

Schelling's Segregation Model
About
Developed by economist Thomas Schelling in 1971, the Schelling model is an agent-based model that demonstrates how individual preferences for similar neighbors can lead to large-scale segregation patterns.
Model Description
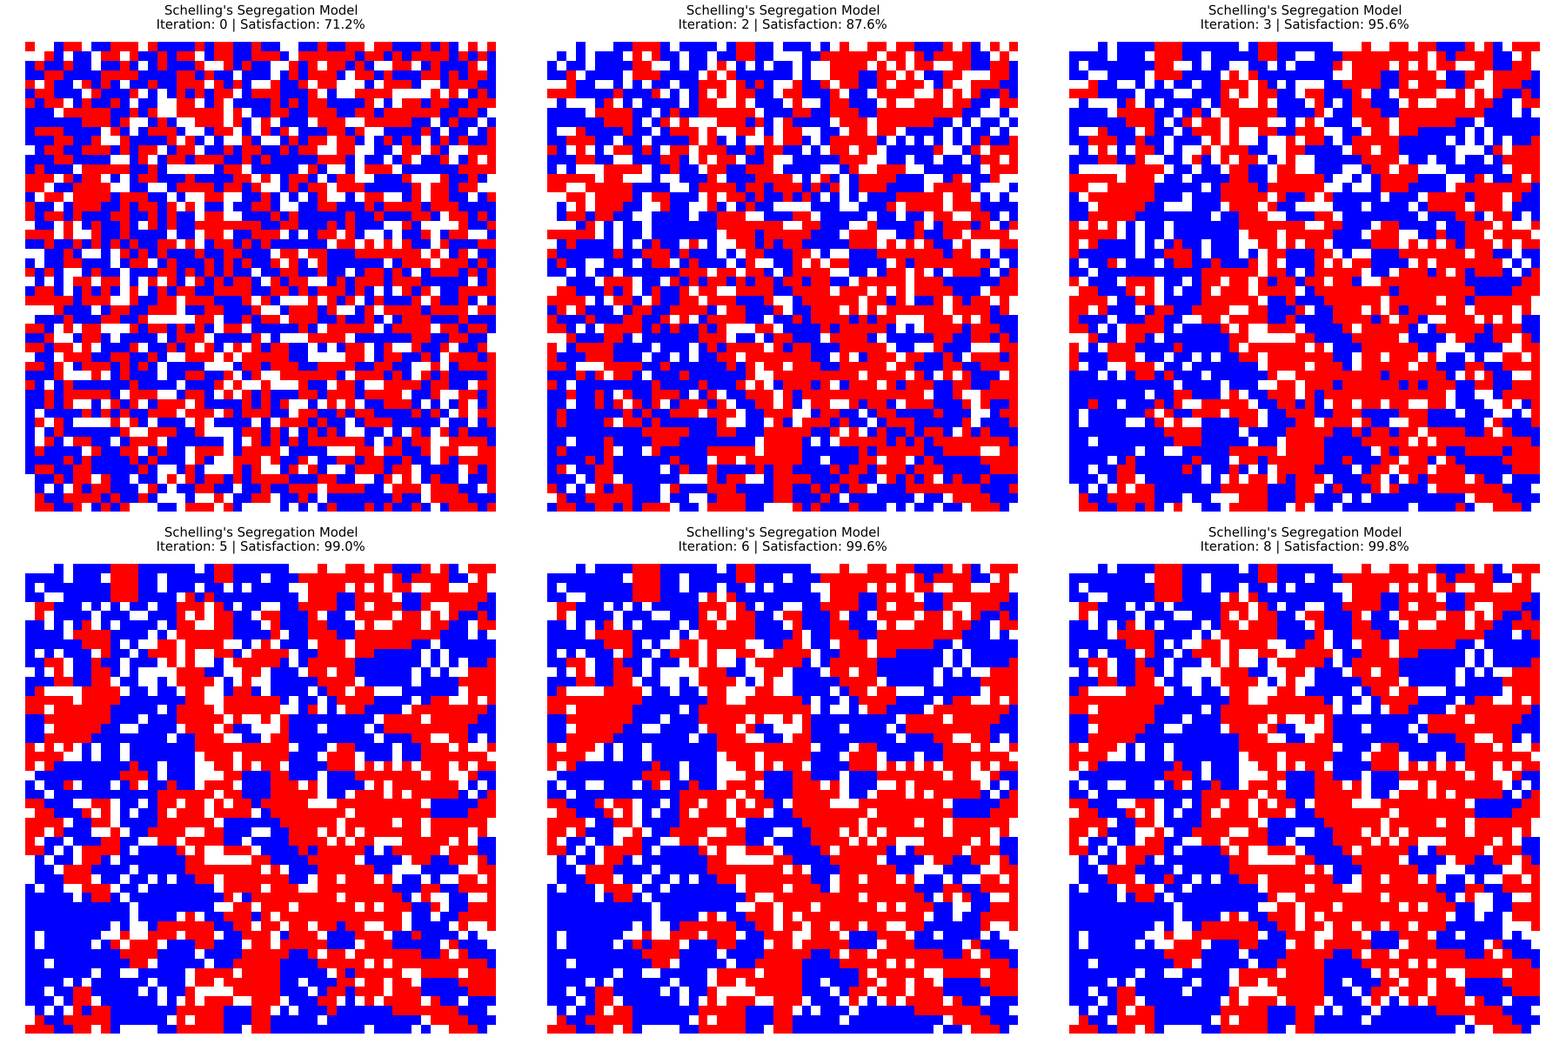
Schelling's model consists of a grid populated by two types of agents (represented as blue and red) and empty spaces. Each agent evaluates their neighborhood and moves if they are dissatisfied with the proportion of similar neighbors.
Parameters
\(N\): Grid size (\(N \times N\) lattice)
\(\rho_{empty}\): Proportion of unoccupied cells
\(B_a\): Similarity threshold. Agents want at least this fraction of similar neighbors
Initial agent distribution: Two groups are distributed across occupied cells
Max iterations
Behavioral Threshold
The similarity threshold \(B_a\) determines agent satisfaction:
\[ s = \frac{n_{similar}}{n_{total}} \geq B_a \]where \(n_{similar}\) is the number of similar neighbors and \(n_{total}\) is the total number of neighbors (excluding empty cells).
Schelling noticed that a threshold of \(B_a \geq B_{\text{seg}} \approx \frac{1}{3}\) causes groups to segregate.
Algorithm
Create \(N \times N\) grid
Randomly assign cells as:
Group A (blue): \((1-\rho_{empty})/2\) of cells
Group B (red): \((1-\rho_{empty})/2\) of cells
Empty: \(\rho_{empty}\) of cells
For each iteration (simulation step):
Evaluate Satisfaction: For each agent at position \((i,j)\), calculate:
where \(N(i,j)\) = Moore neighborhood (8 adjacent cells), and the Iverson bracket is defined,
\[ [P] = \begin{cases} 1 & \text{if } P \text{ is true}\\ 0 & \text{otherwise} \end{cases} \]where \(P\) is a logical proposition.
Relocate unsatisfied agents: If \(s_{i,j} < B_a\), move agent to a random empty cell
Update metrics: Calculate global satisfaction rate: \( S = \frac{1}{n_{agents}}\sum_{i,j} [s_{i,j} \geq B_a] \)
Repeat until:
No agents move in an iteration, or
Maximum iterations reached (default: 100)
Discussion
Inaccuracies
If the model is interpreted as people or households on a spatial grid, it suffers some short-comings:
Some people are more biased towards a similar group identity than others
There are other concerns in a persons life other than their immediate neighbors' group identities
The group identities of an agent's neighbors are not always known to the agent immediately if ever
Group identities may change and even be influenced by neighbors or other factors such as social media
Neighborhood Definition
Uses Moore neighborhood (8-neighborhood) including diagonal neighbors. Von Neumann neighborhood (4-neighborhood) is an alternative that produces different dynamics.
Movement Strategy
Agents relocate to random empty cells. Alternative strategies include:
Nearest empty cell
Best available location (most similar neighbors)
Probabilistic movement based on dissatisfaction level
Computational Complexity
Time per iteration: \(O(N^2)\) for grid traversal
Space complexity: \(O(N^2)\) for grid storage
Extensions
Possible model enhancements:
Multiple group types (\(k > 2\))
Heterogeneous thresholds across agents
Weighted preferences (e.g., preference strength varies)
Network topologies beyond regular grids
Economic constraints on movement
Continuous groups instead of discrete (discussed below)
A 2D Spectrum Segregation Model
Model Description
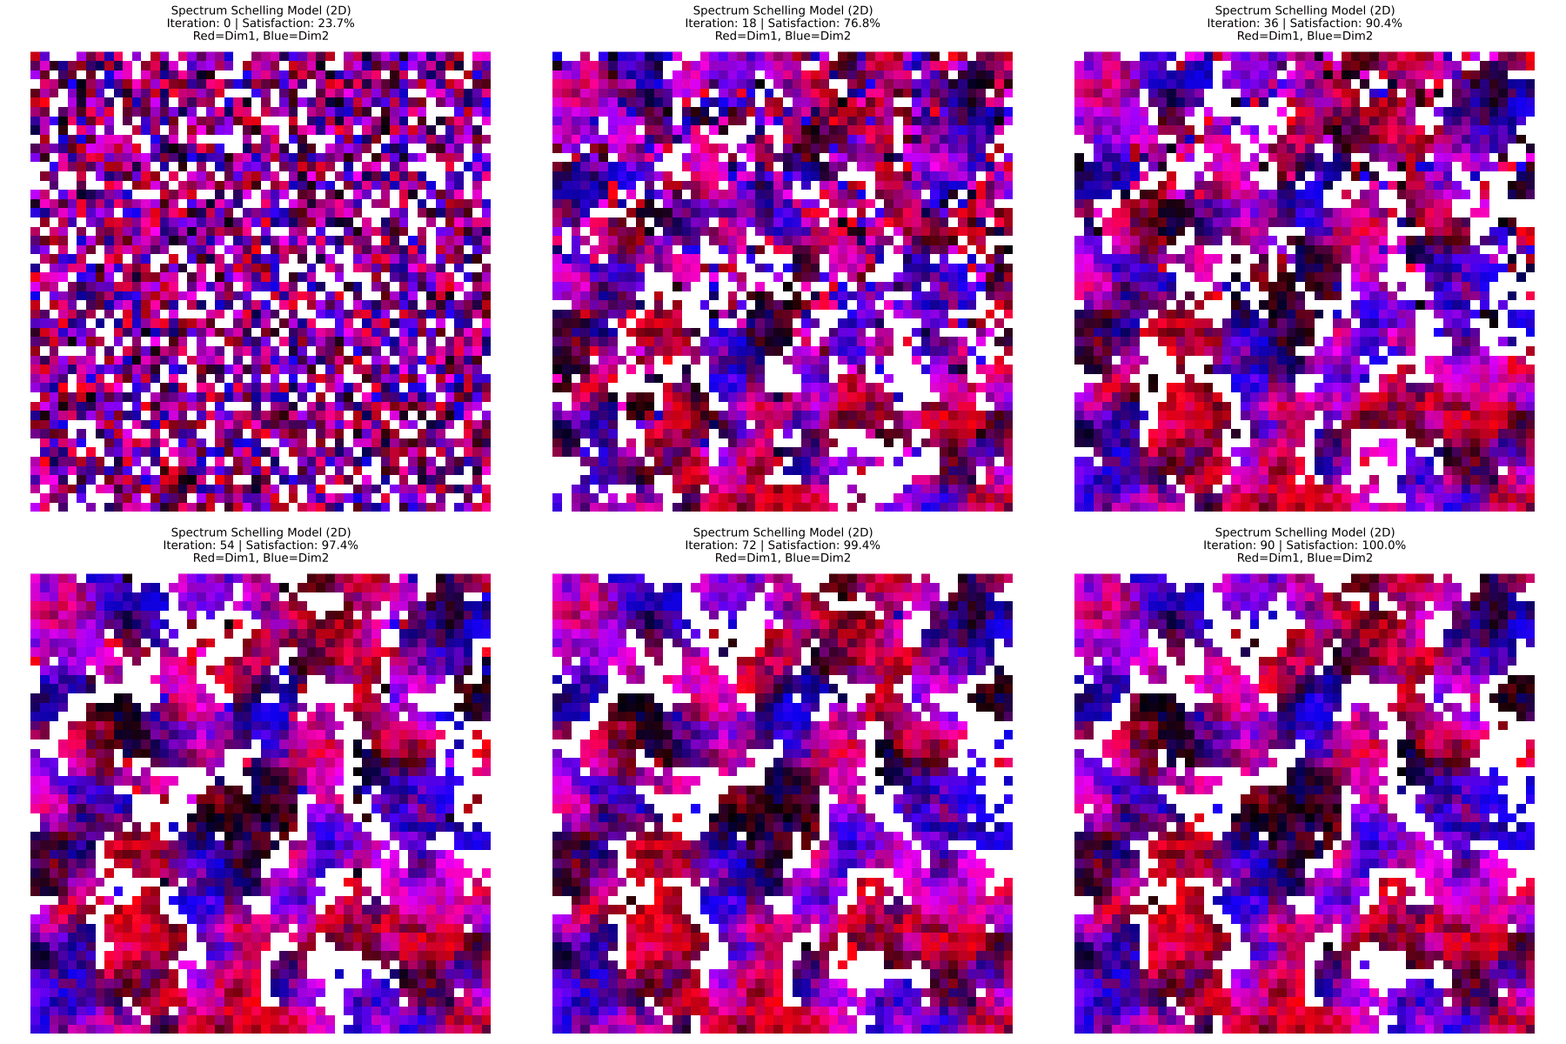
Drawing inspiration from the 2D political spectrum, we extend Schelling's model from discrete binary groups to continuous two-dimensional spectrums that describe an agent's group identity.
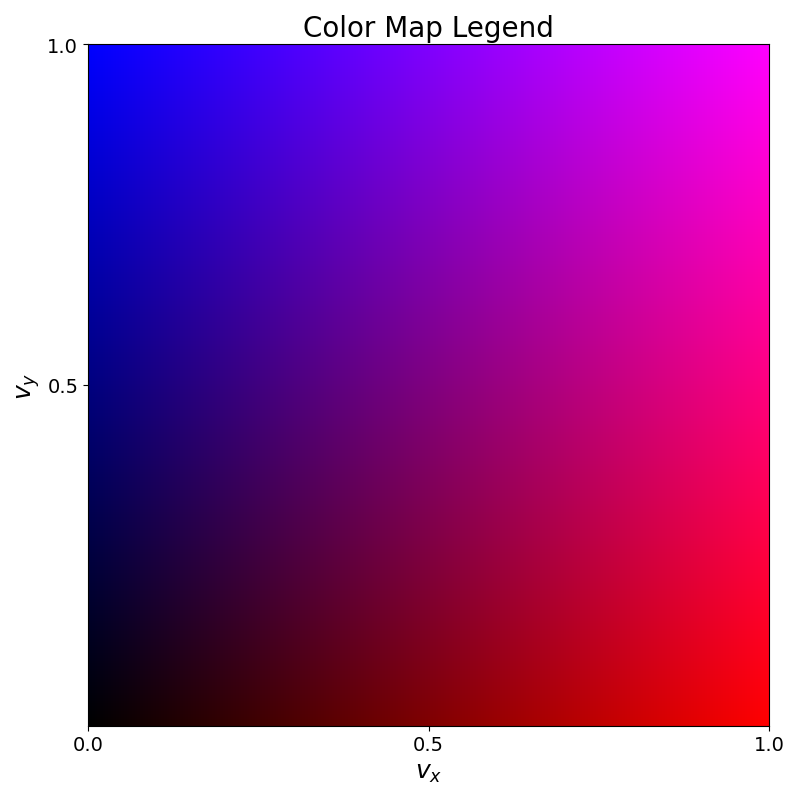
Instead of discrete group membership (red or blue), each agent is characterized by a position in continuous 2D space:
\[ \mathbf{v}_a = (v_{x}, v_{y}) \in [0,1]^2 \]where each dimension represents an independent spectrum of characteristics.
Modified Similarity Metric
The similarity threshold now operates on distance in spectrum space rather than discrete group membership. Agent satisfaction is determined by:
\[ d_{i, j} = \frac{1}{|N(i,j)|}\sum_{(k,l) \in N(i,j)} \|\mathbf{v}_{i,j} - \mathbf{v}_{k,l}\|_2 \]where \(\|\cdot\|_2\) denotes the Euclidean distance between spectrum positions.
An agent at position \((i,j)\) is satisfied when:
\[ s_{i, j} = \frac{d_{i, j}}{\sqrt{D}} \leq B_a \]where \(D\) is the number of dimensions (here \(D=2\)) and the normalization factor \(\sqrt{D}\) accounts for the maximum possible distance in \(D\)-dimensional unit hypercube space.
Algorithm Modifications
The algorithm remains largely identical to the original Schelling model, with these changes:
Group assignment replaced by: For each occupied cell, sample \(\mathbf{v} \sim \text{Uniform}([0,1]^2)\)
Replace discrete type matching with continuous distance calculation
Agent \((i,j)\) is satisfied if \(\frac{1}{|N(i,j)|}\sum_{(k,l) \in N(i,j)} \| \mathbf{v}_{i,j} - \mathbf{v}_{k,l} \|_2 \cdot \frac{1}{\sqrt{2}} \leq B_a\)
Emergent Behavior
The continuous spectrum model exhibits similar segregation dynamics to the binary model but with additional nuances:
Agents form gradient-like clusters rather than sharp boundaries
Segregation occurs along both dimensions simultaneously, creating multi-modal spatial patterns
The same critical threshold \(B_a \approx \frac{1}{3}\) produces segregation, despite the infinite possible "group" identities
References
[1] Schelling, T. C. (1969). Models of Segregation. American Economic Review, 59(2), 488-493.